A Building Measured in Megawatts
Drive past a datacenter and you see a windowless warehouse. But the industry never describes one by floor area — it describes it by power draw, in megawatts (MW), because electricity is the input every other subsystem scales from. Every watt fed into a chip comes back out as heat that must be removed, so power sets the size of the cooling plant. Power determines the transformers, the backup generators, the batteries. And for an AI cloud, power is literally the unit of revenue: SemiAnalysis estimates an AI cloud earns roughly $10-12M of revenue per megawatt per year. The most useful mental model for this whole module: a datacenter is a single machine whose job is converting electrons into tokens.
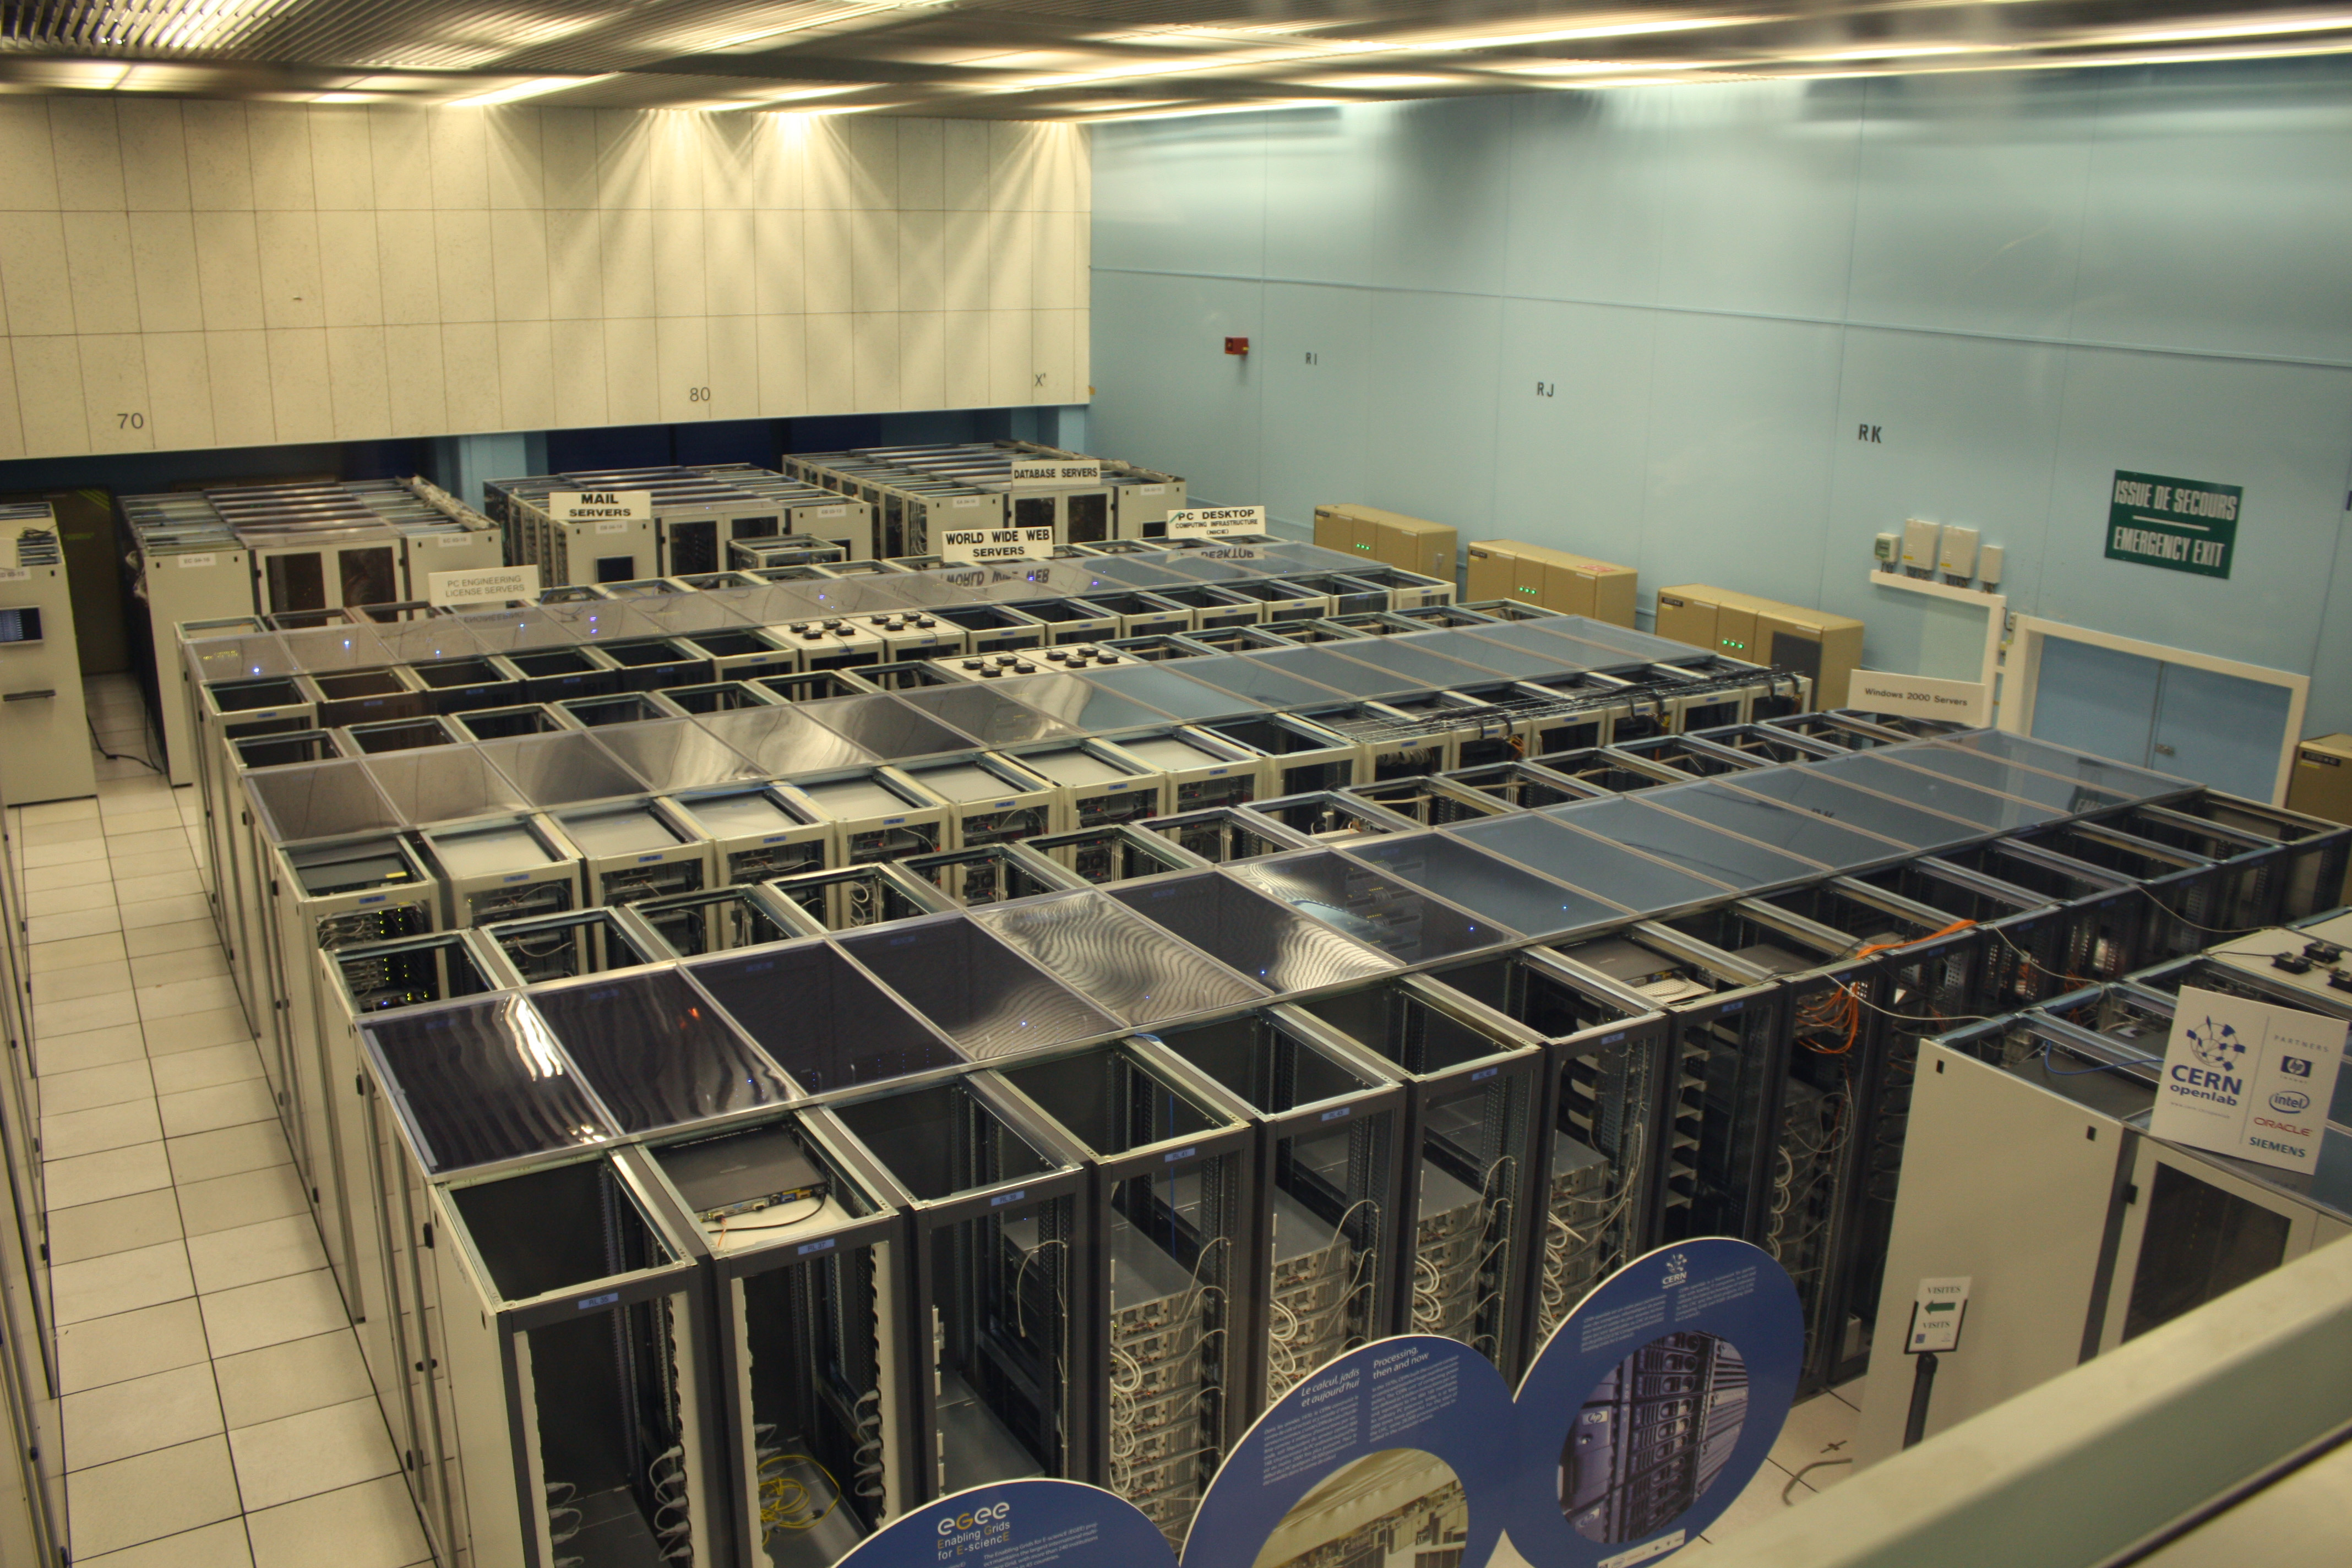
Two pieces of jargon carve up the building. White space is where the computers live — the halls of racks. Grey space is everything that feeds them: transformer rooms, switchgear, walls of UPS batteries, plus the yard outside — a dedicated substation, diesel generators, chillers and cooling towers. In an AI datacenter, grey space and the yard are most of the capital cost.
Now make '100MW' concrete. Nvidia's flagship GB200 NVL72 rack draws about 120kW and packs 72 GPUs. So 100MW of IT load is roughly 830 such racks — on the order of 60,000 GPUs — spread across a few halls, fed by their own substation, earning around a billion dollars of AI cloud revenue a year. And 100MW is no longer 'big': xAI's Colossus 2 crossed the gigawatt (1,000MW) line, and multi-GW campuses are in planning. At this scale, a datacenter is not a building with some electrical gear inside; it is a power plant's worth of load with a building wrapped around it.
The Power Chain: From 345,000 Volts to Less Than One
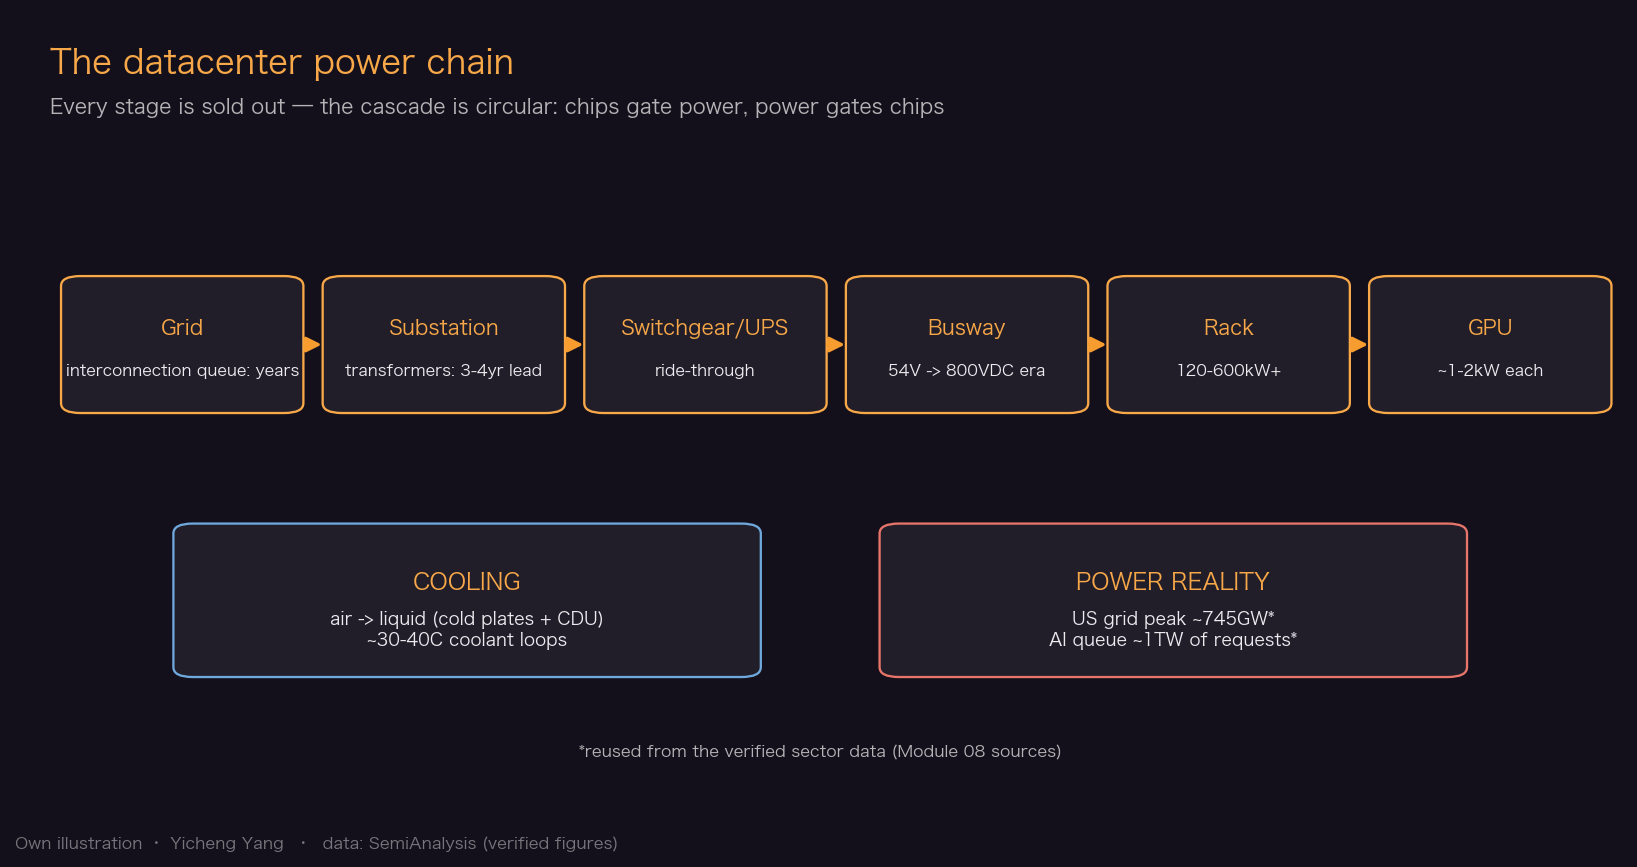
Electricity arrives at the site at transmission voltage — commonly 115,000 to 345,000 volts — and ends its journey at under 1 volt at the GPU's pins. The whole electrical design of a datacenter is a staircase down that range, governed by one physics rule: for a given power, current falls as voltage rises (power = voltage × current), and the heat wasted in a wire grows with the square of the current (I²R). Voltage is water pressure: high pressure lets a thin pipe carry the same flow; low pressure demands an enormous pipe — in electrical terms, absurd amounts of copper.
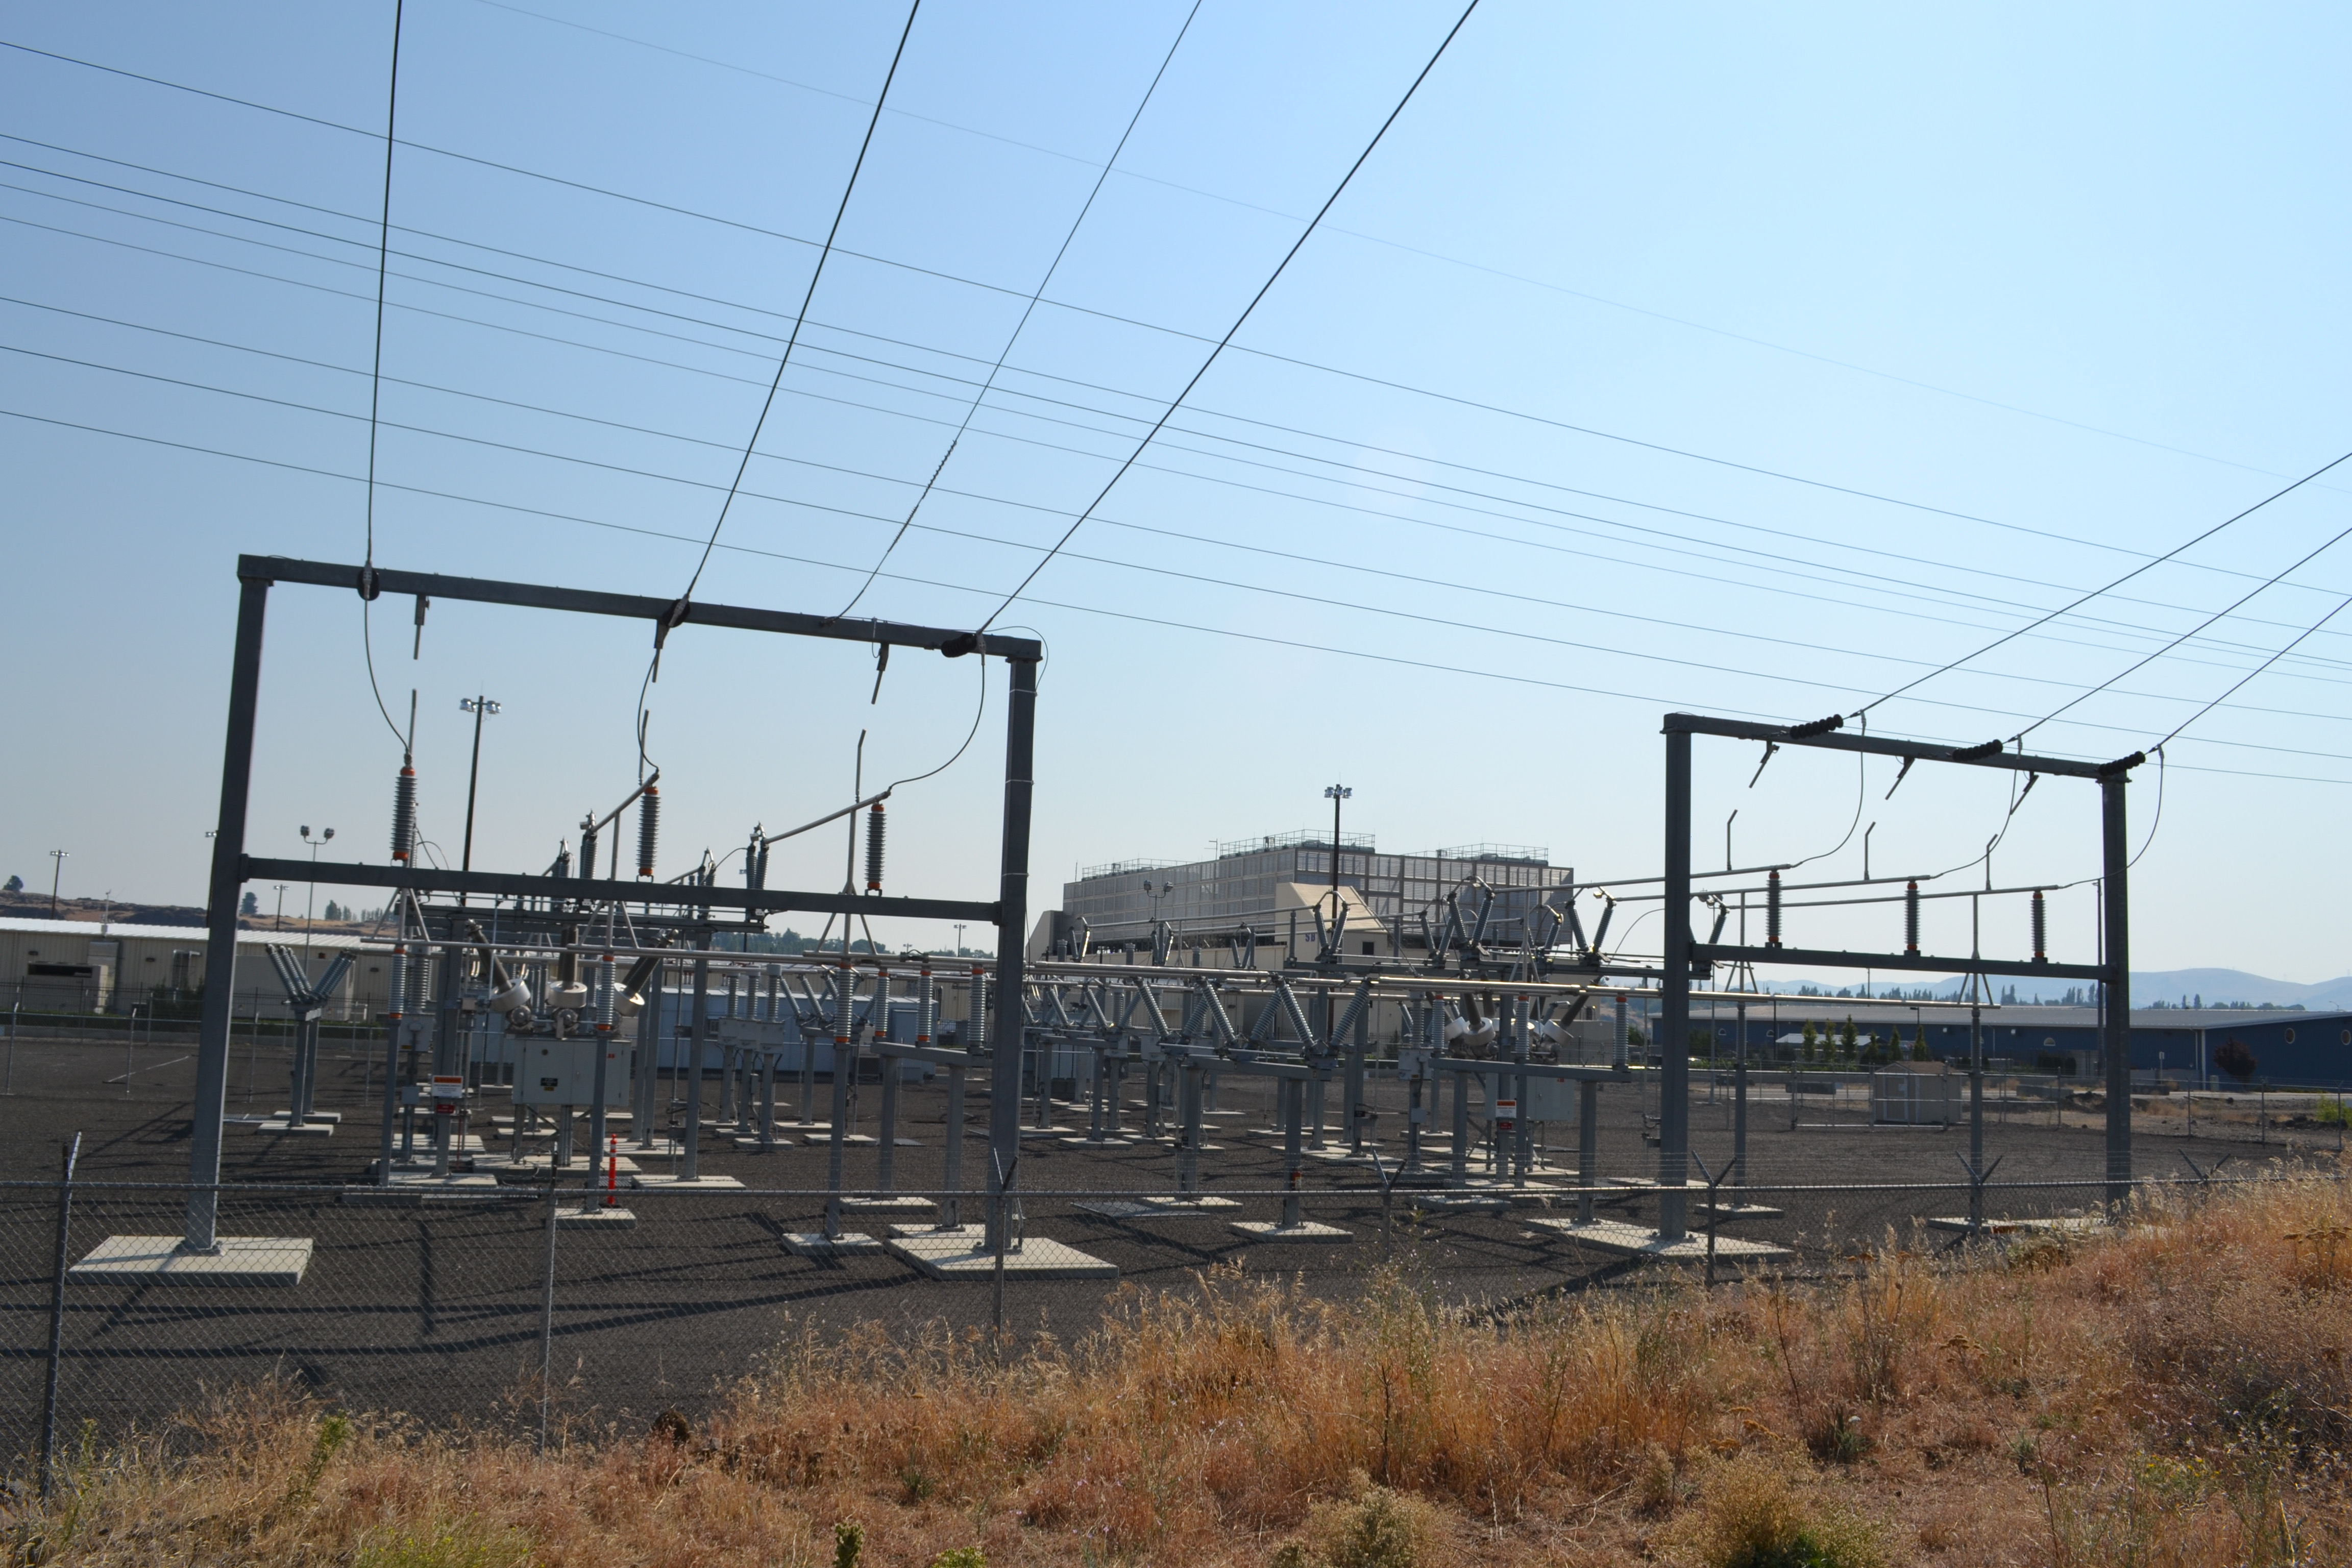
The staircase: the onsite substation steps transmission down to medium voltage (13.8-45kV), which runs to each building. Transformers step that to low voltage (~415V AC). Switchgear — industrial circuit breakers — protects each branch. The UPS (uninterruptible power supply), a wall of batteries, rides through flickers and carries the whole load for the seconds-to-minutes the diesel generators need to start. Overhead busways — rigid copper rails, a highway for current — run above the rack rows. Inside the rack, power shelves rectify AC to 54V DC onto a copper busbar running down the rack's spine, and finally VRMs (voltage regulator modules) sitting millimeters from each GPU make the last step to below 1V.
AI broke the bottom of this staircase. At 48-54V, a 600kW-class rack would draw ~12,500 amps — a megawatt-class rack would need ~200kg of copper busbar, with power shelves crowding out the compute. At 800V DC the same rack draws ~750A: ~16.7x less current, and roughly 220-278x less resistive heating. Hence the industry-wide move to 800VDC (Nvidia's reference design; Google/Meta/Microsoft's ±400V variant reuses the electric-vehicle supply chain): rectification moves out of the rack into a dedicated 'power rack' sidecar (~$400-500k apiece), the central UPS is eventually eliminated, and end-to-end electrical efficiency rises from ~82% toward ~87.4% — worth ~50MW of freed power at a gigawatt campus. The endgame is the solid-state transformer: one semiconductor box converting medium voltage straight to 800VDC.
PUE: The Machine's Efficiency Score
PUE — Power Usage Effectiveness — is the single number the industry uses to grade the machine: total facility power divided by IT power. A PUE of 1.6 means that for every watt reaching a computer, another 0.6W is spent on overhead. Where does the overhead go? Cooling takes 60-80% of it; electrical conversion losses (every transformer and UPS stage on the staircase above leaks a little heat) take 15-30%.
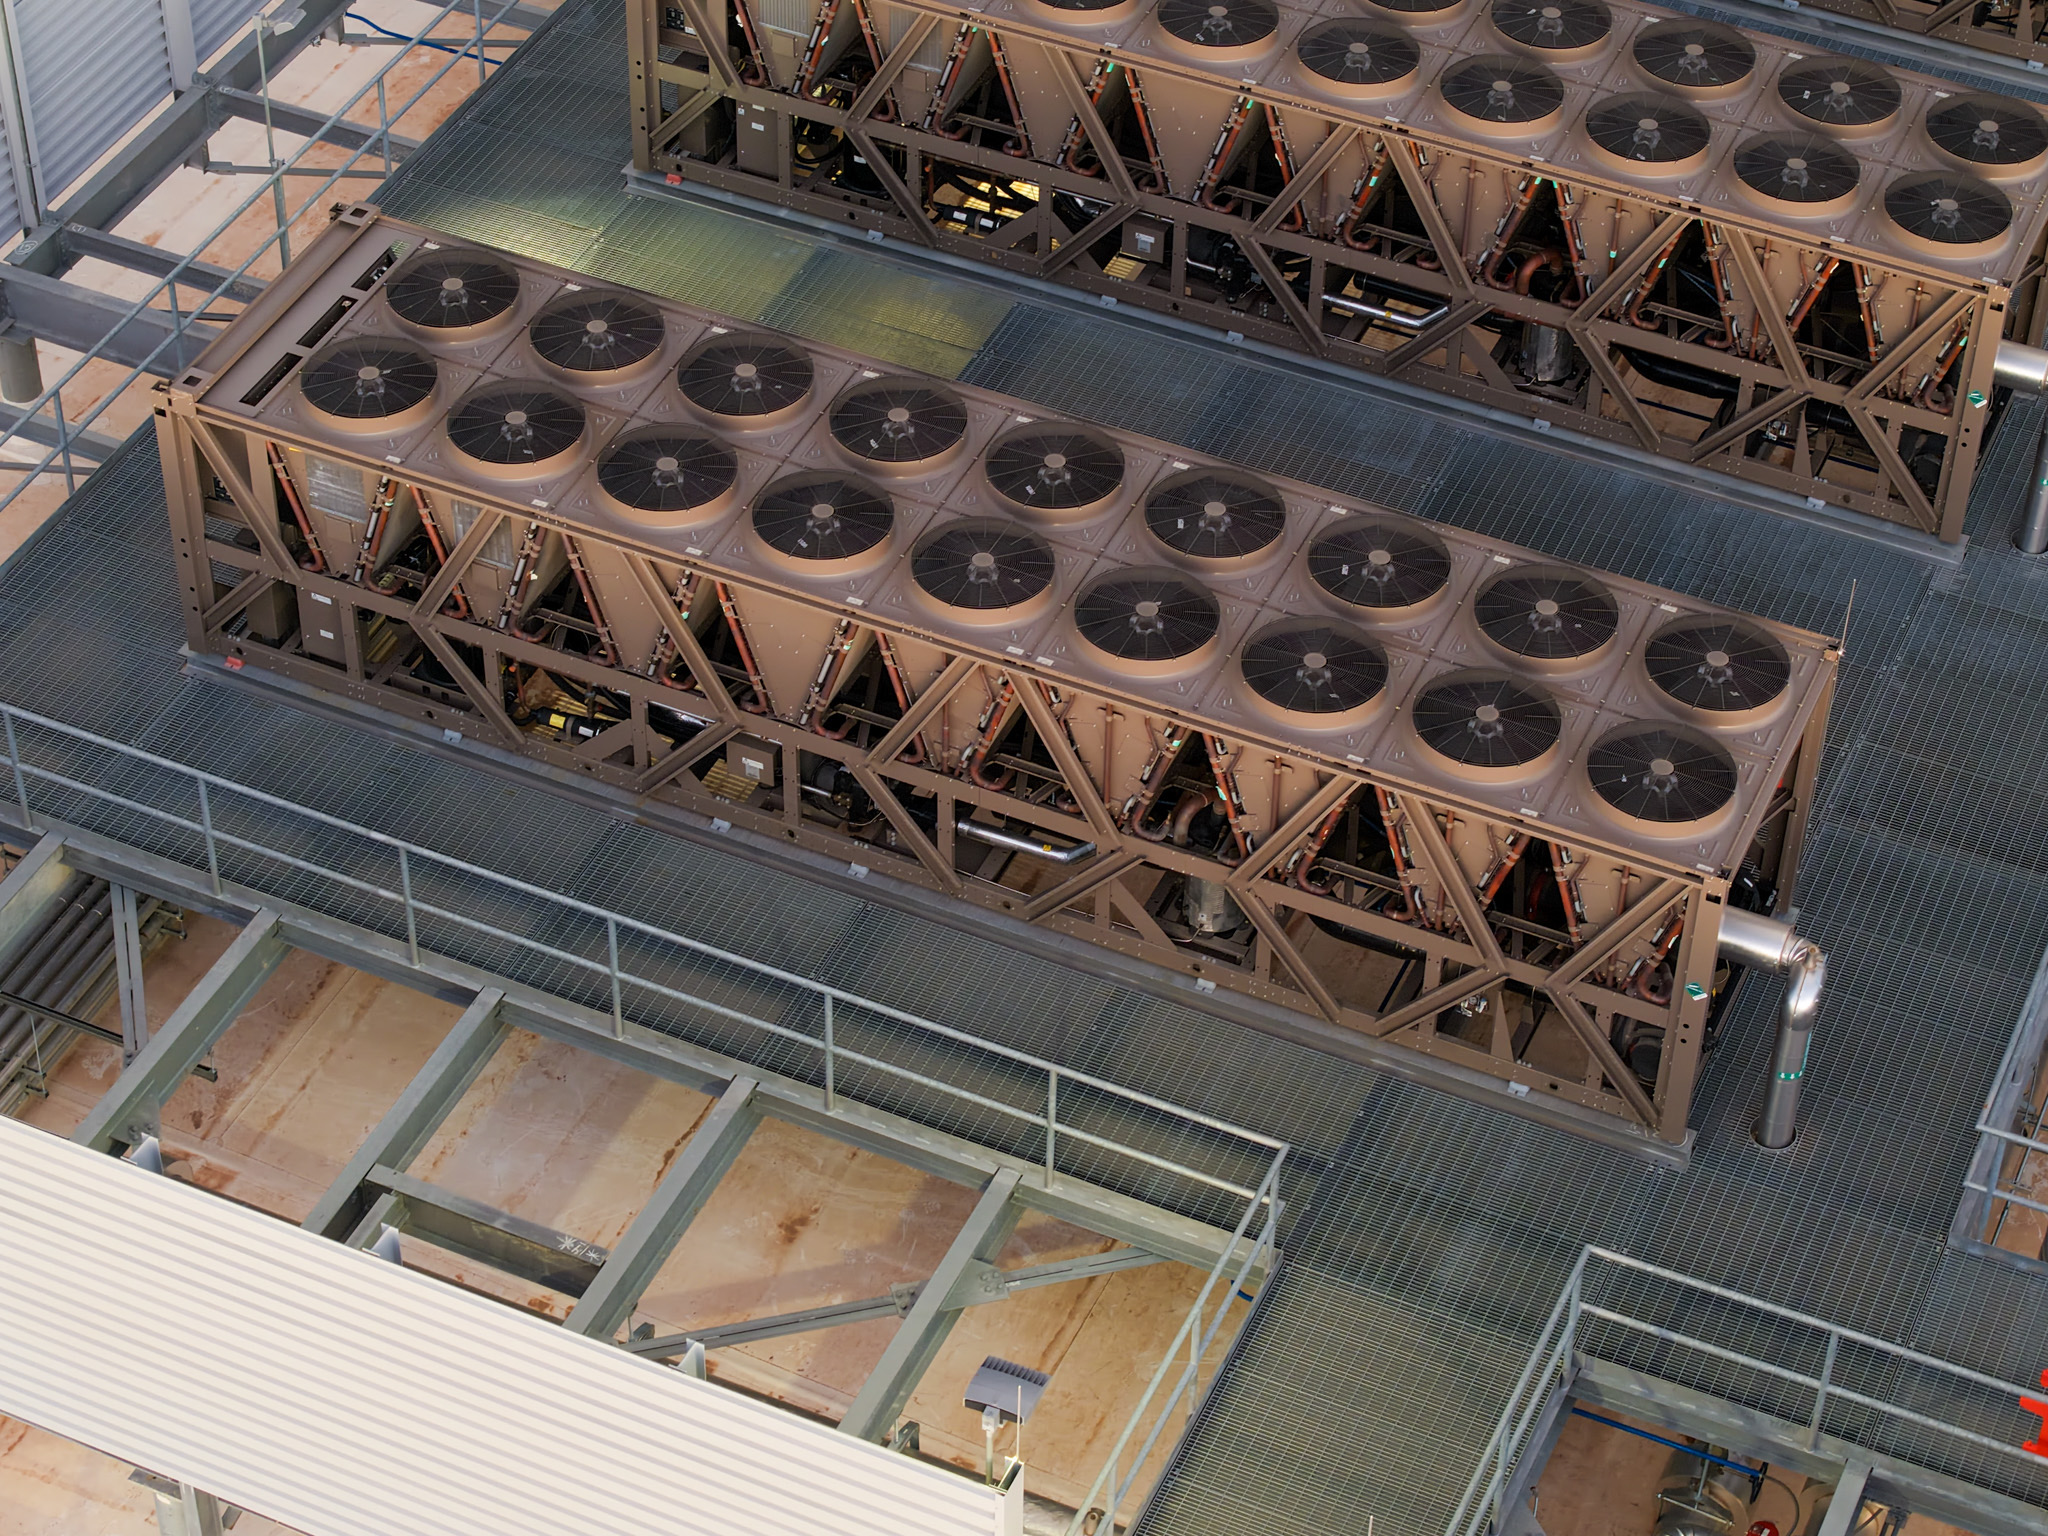
The industry average is about 1.6 — and, crucially, that Uptime Institute survey figure excludes hyperscalers. Google and Meta run around 1.1, Microsoft and AWS around 1.15, and Meta's best design hits 1.08. They get there with mechanisms, not magic: free cooling — using outside air or water whenever the weather allows, instead of running energy-hungry compressor chillers; running servers hot, with inlet air above 30°C, which only works because they design their own servers; and obsessive airflow engineering, exploiting the cubic Fan Law — cut airflow 10% and fan energy falls ~27%.
Why an investor should care about a decimal: at a 100MW-IT site, the gap between PUE 1.6 and 1.1 is 50MW of facility load — power that either buys more GPUs or simply does not exist at a grid-constrained site. In the power-scarce world of the next section, PUE stops being an environmental metric and becomes a capacity multiplier. Two caveats keep you honest: PUE says nothing about water (that is WUE, liters per kWh — evaporative cooling trades water for electricity), and it says nothing about losses inside the IT itself, which is exactly what the 800VDC transition attacks.
Cooling: The End of the Air Era
Everything the power chain delivers, the cooling chain must carry away — the same megawatts, in reverse, as heat. For thirty years air did the job: cold air pushed through the room by CRAH units or whole fan walls, guided into cold aisles, sucked through the servers by their own fans, exhausted into hot aisles, and carried back to heat exchangers. Air is wonderful because it is free and can't leak onto electronics — and terrible because it holds very little heat per liter. As chips passed ~1,000W, air cooling remained possible only in bulky low-density chassis; what actually forced liquid was rack density economics — packing 72 GPUs into one 120kW NVLink rack leaves no room for the airflow required.
So AI hardware switched the medium. In direct-to-chip liquid cooling (DLC), a cold plate — a metal block laced with fine channels — is clamped onto each chip, and coolant flows directly against the silicon. Nvidia's GB200 NVL72, the highest-volume Blackwell rack, is liquid-cooled only: 120kW in a single cabinet, unthinkable with air. The rack's loops connect through quick disconnects — no-drip couplings that let a technician pull a server without draining the system; Nvidia's ramp made even these humble parts a shortage item. The rack's heat then flows to a CDU (coolant distribution unit, often >1MW of heat exchange), which transfers it into the facility's water loop; from there it leaves the building through cooling towers, dry coolers or chillers. A halfway technology, the rear-door heat exchanger (RDHx, a radiator bolted where the rack's back door was, 30-50kW), bridges older air-built halls into the liquid era — xAI's Memphis site famously mixed RDHx with DLC.
For investors, one structural fact: cooling is the second-largest capex system after electrical, and the fastest-evolving — which makes it simultaneously the growth story (CDUs, cold plates, quick disconnects) and the obsolescence risk of the sector.
Why Power Became the Binding Constraint
For decades, datacenter operators treated electricity like water from a tap: apply to the utility, wait, get connected. AI broke that assumption with sheer arithmetic. The US datacenter buildout is running at +21GW in 2026, heading toward +84GW a year by 2030 — against a US grid whose all-time peak load is about 759GW (set July 2025) and which adds only ~15GW of net-new firm capacity a year. Roughly a terawatt of load requests now sits in US interconnection queues; a grid connection takes ~5 years (7 in Northern Virginia), and on current math grid headroom — supply minus peak demand minus required reserves — turns negative across a growing set of US regions by 2027. The grid is, in SemiAnalysis's phrase, sold out.
What makes the shortage explosive is the economics stacked on top. At ~$10-12M of revenue per MW per year, getting 200MW online six months earlier is worth about a billion dollars — so 'speed is the moat', and any amount of money spent to jump the queue is rational. The queue-jump is called behind-the-meter (BTM) power: instead of waiting for the utility, you generate onsite — gas turbines, reciprocating engines, fuel cells. xAI proved the play by building Colossus in ~122 days on rented, truck-mounted turbines; OpenAI and Oracle followed with a 2.3GW onsite order in Texas. BTM powered under 7% of new US datacenter capacity in 2025; SemiAnalysis expects it to power more than half by 2028 — which is why gas-turbine makers (GE Vernova, Siemens Energy, Mitsubishi) are order-booked into 2028-29.
One last wrinkle completes the picture: AI is not just a big load but a violently twitchy one. Synchronized GPU training swings power ~15x more than a cloud datacenter (Google measured 1.5MW→15MW swings), fast enough to threaten grid stability — pulling batteries, flywheels and capacitor banks into the machine's bill of materials too.



Key Numbers
Sources
- SemiAnalysis — Datacenter Anatomy Part 2 – Cooling Systems
- SemiAnalysis — Inside the 800VDC Revolution – Part 1
- SemiAnalysis — 'How AI Labs Are Solving the Power Crisis: The Onsite Gas Deep Dive' (~1 terawatt of load requests); 'AI Training Load Fluctuations at Gigawatt-scale - Risk of Power Grid Blackout?' (~745GW all-time US peak); 'US Grid Constraints: Towards 40GW+ of Behind-The-Meter Datacenter by 2028?' (grid headroom negative by 2027)
- SemiAnalysis — 'US Grid Constraints: Towards 40GW+ of Behind-The-Meter Datacenter by 2028?' (>50% in 2028+); 'To Boldly Go: The Case for Space Datacenters' (fewer than 7% of capacity added in 2025)
- SemiAnalysis — AI Training Load Fluctuations at Gigawatt-scale - Risk of Power Grid Blackout?
- Wikimedia Commons (CC BY-SA 3.0, Visitor7)
- Wikimedia Commons (CC0, Rsparks3)
- Wikimedia Commons (CC BY-SA 3.0, Hugovanmeijeren)
- SemiAnalysis — xAI's Colossus 2: First Gigawatt Datacenter In The World
- SemiAnalysis — To Boldly Go: The Case for Space Datacenters ('North Virginia's PJM interconnection timelines now run to roughly seven years in practice')
- SemiAnalysis — Stop Saying Half of 2026 US Datacenter Capacity Is Delayed
Related sector deep-dives
Optional — jump ahead if this module is all you needed; otherwise continue the ladder above.